Generate a Class Diagram
Classic UML-style class diagrams with typed relationships, auto-generated from your real code — always in sync.
What is a Class Diagram?
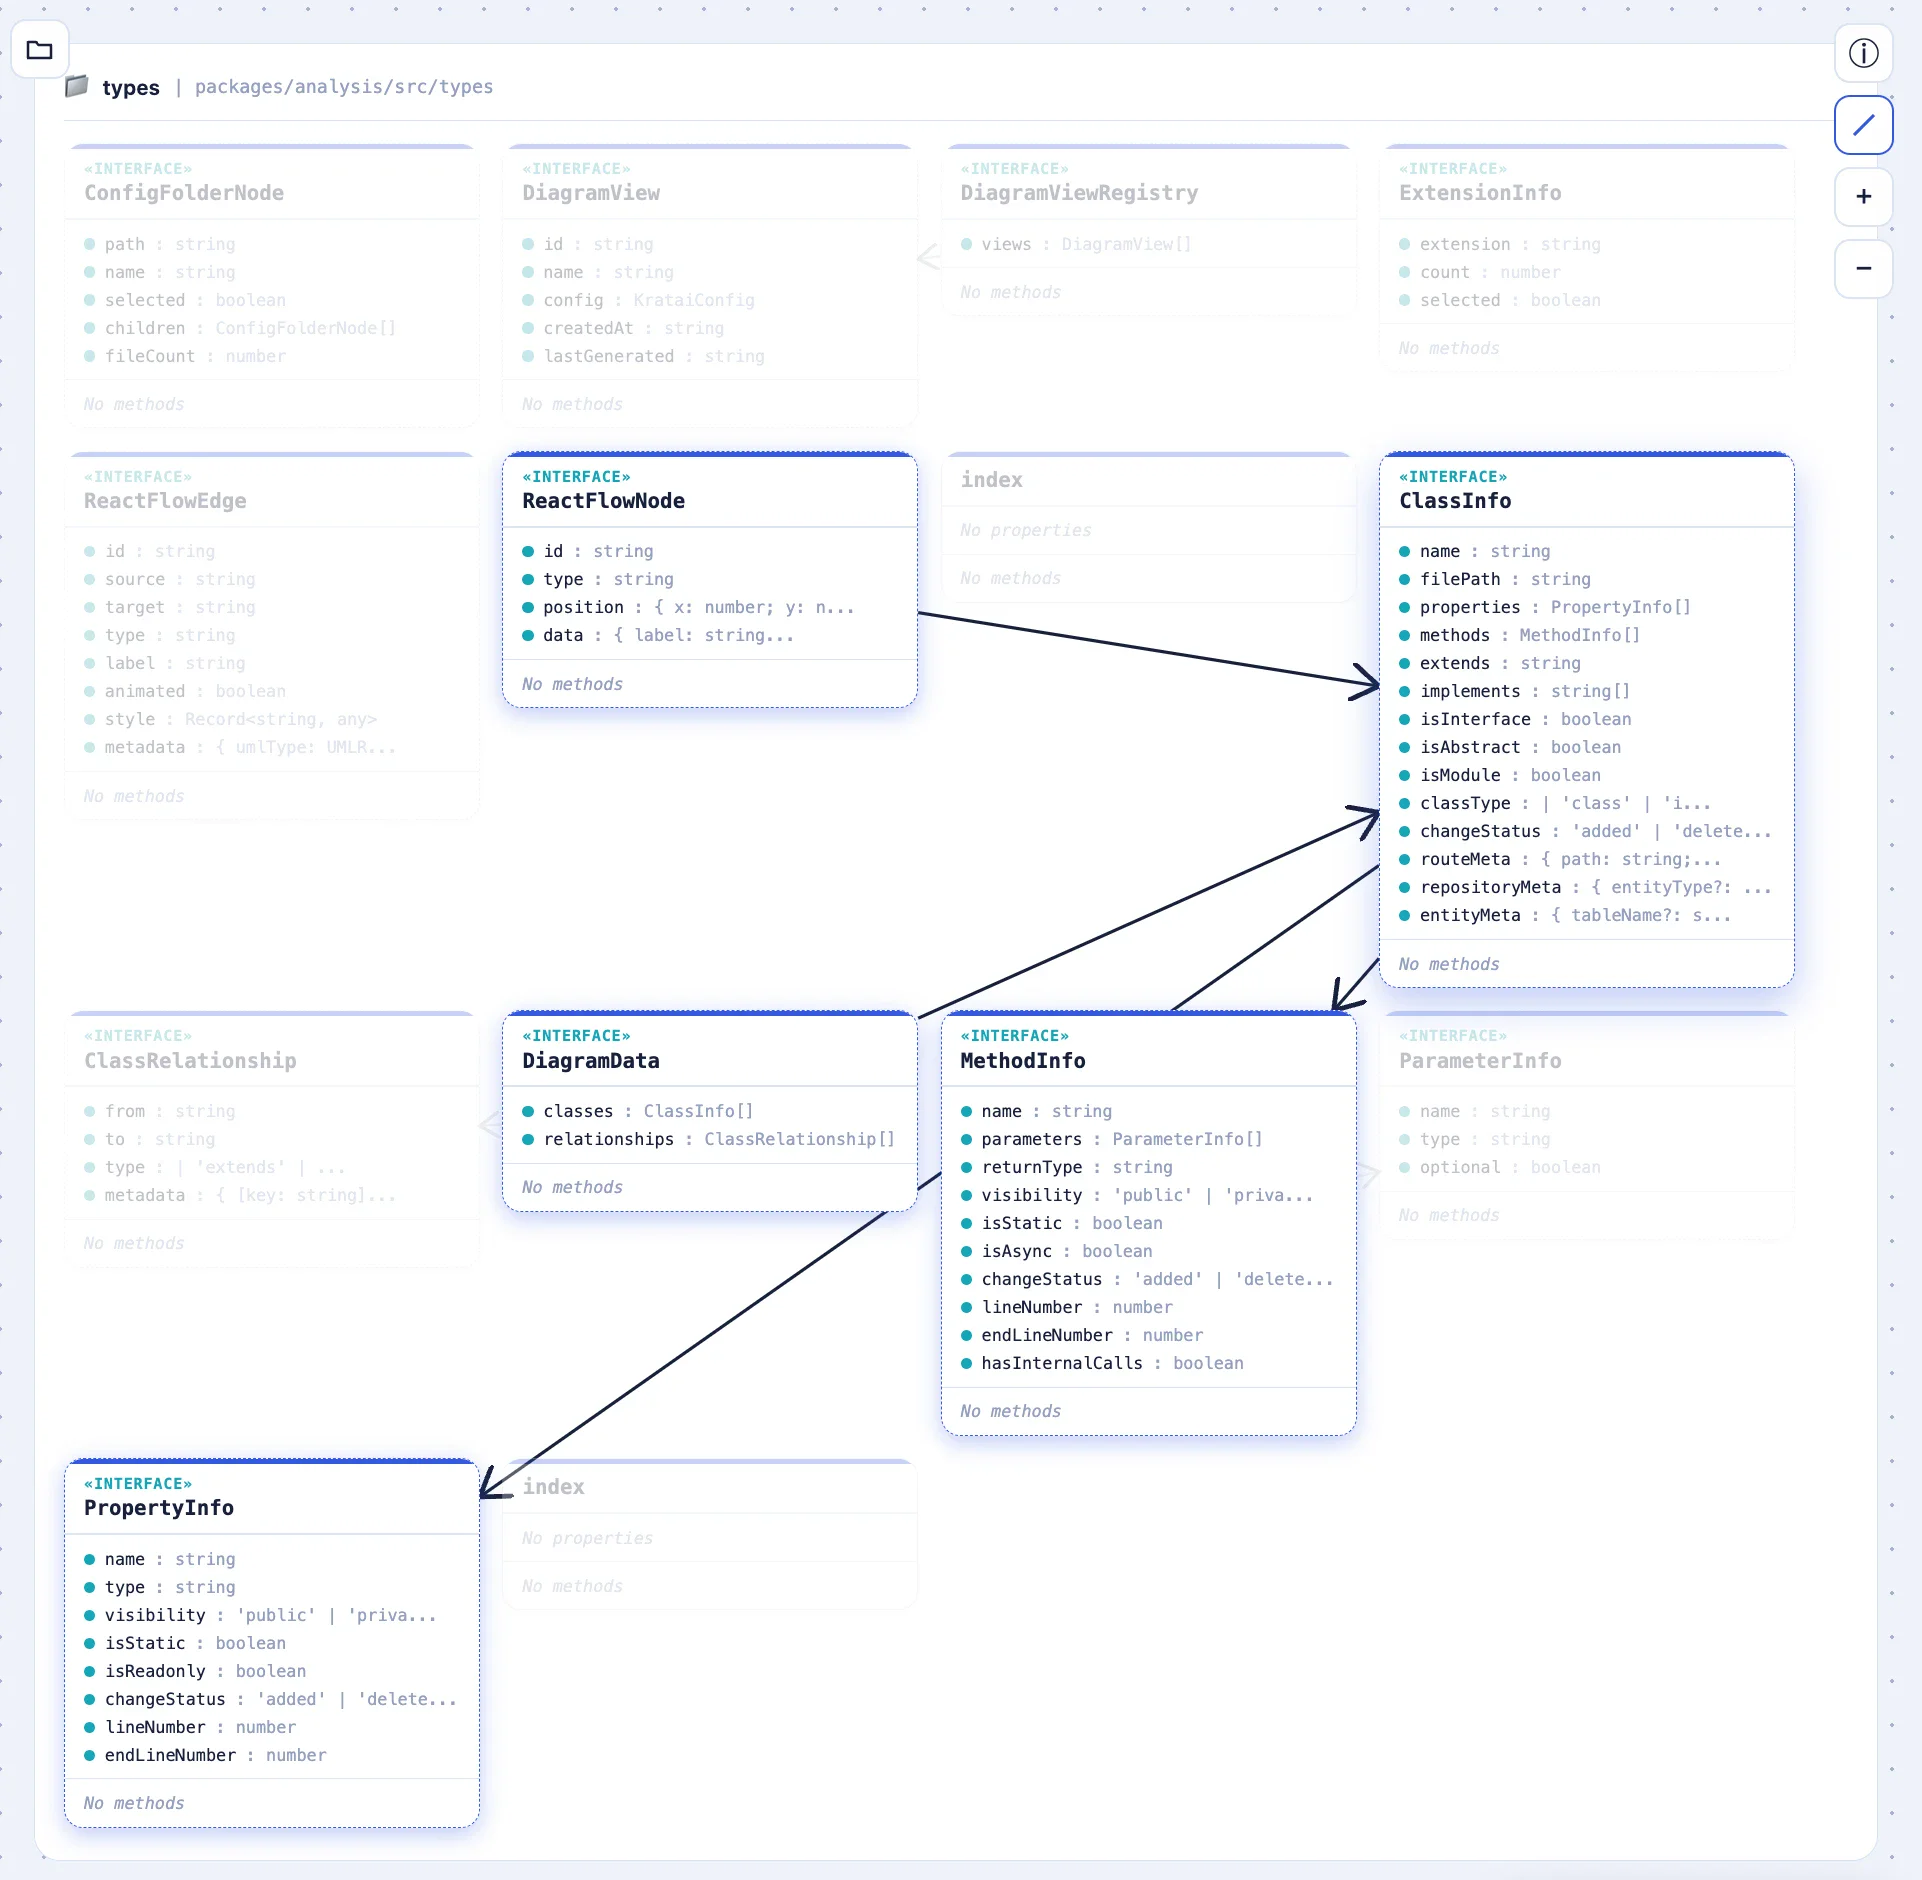
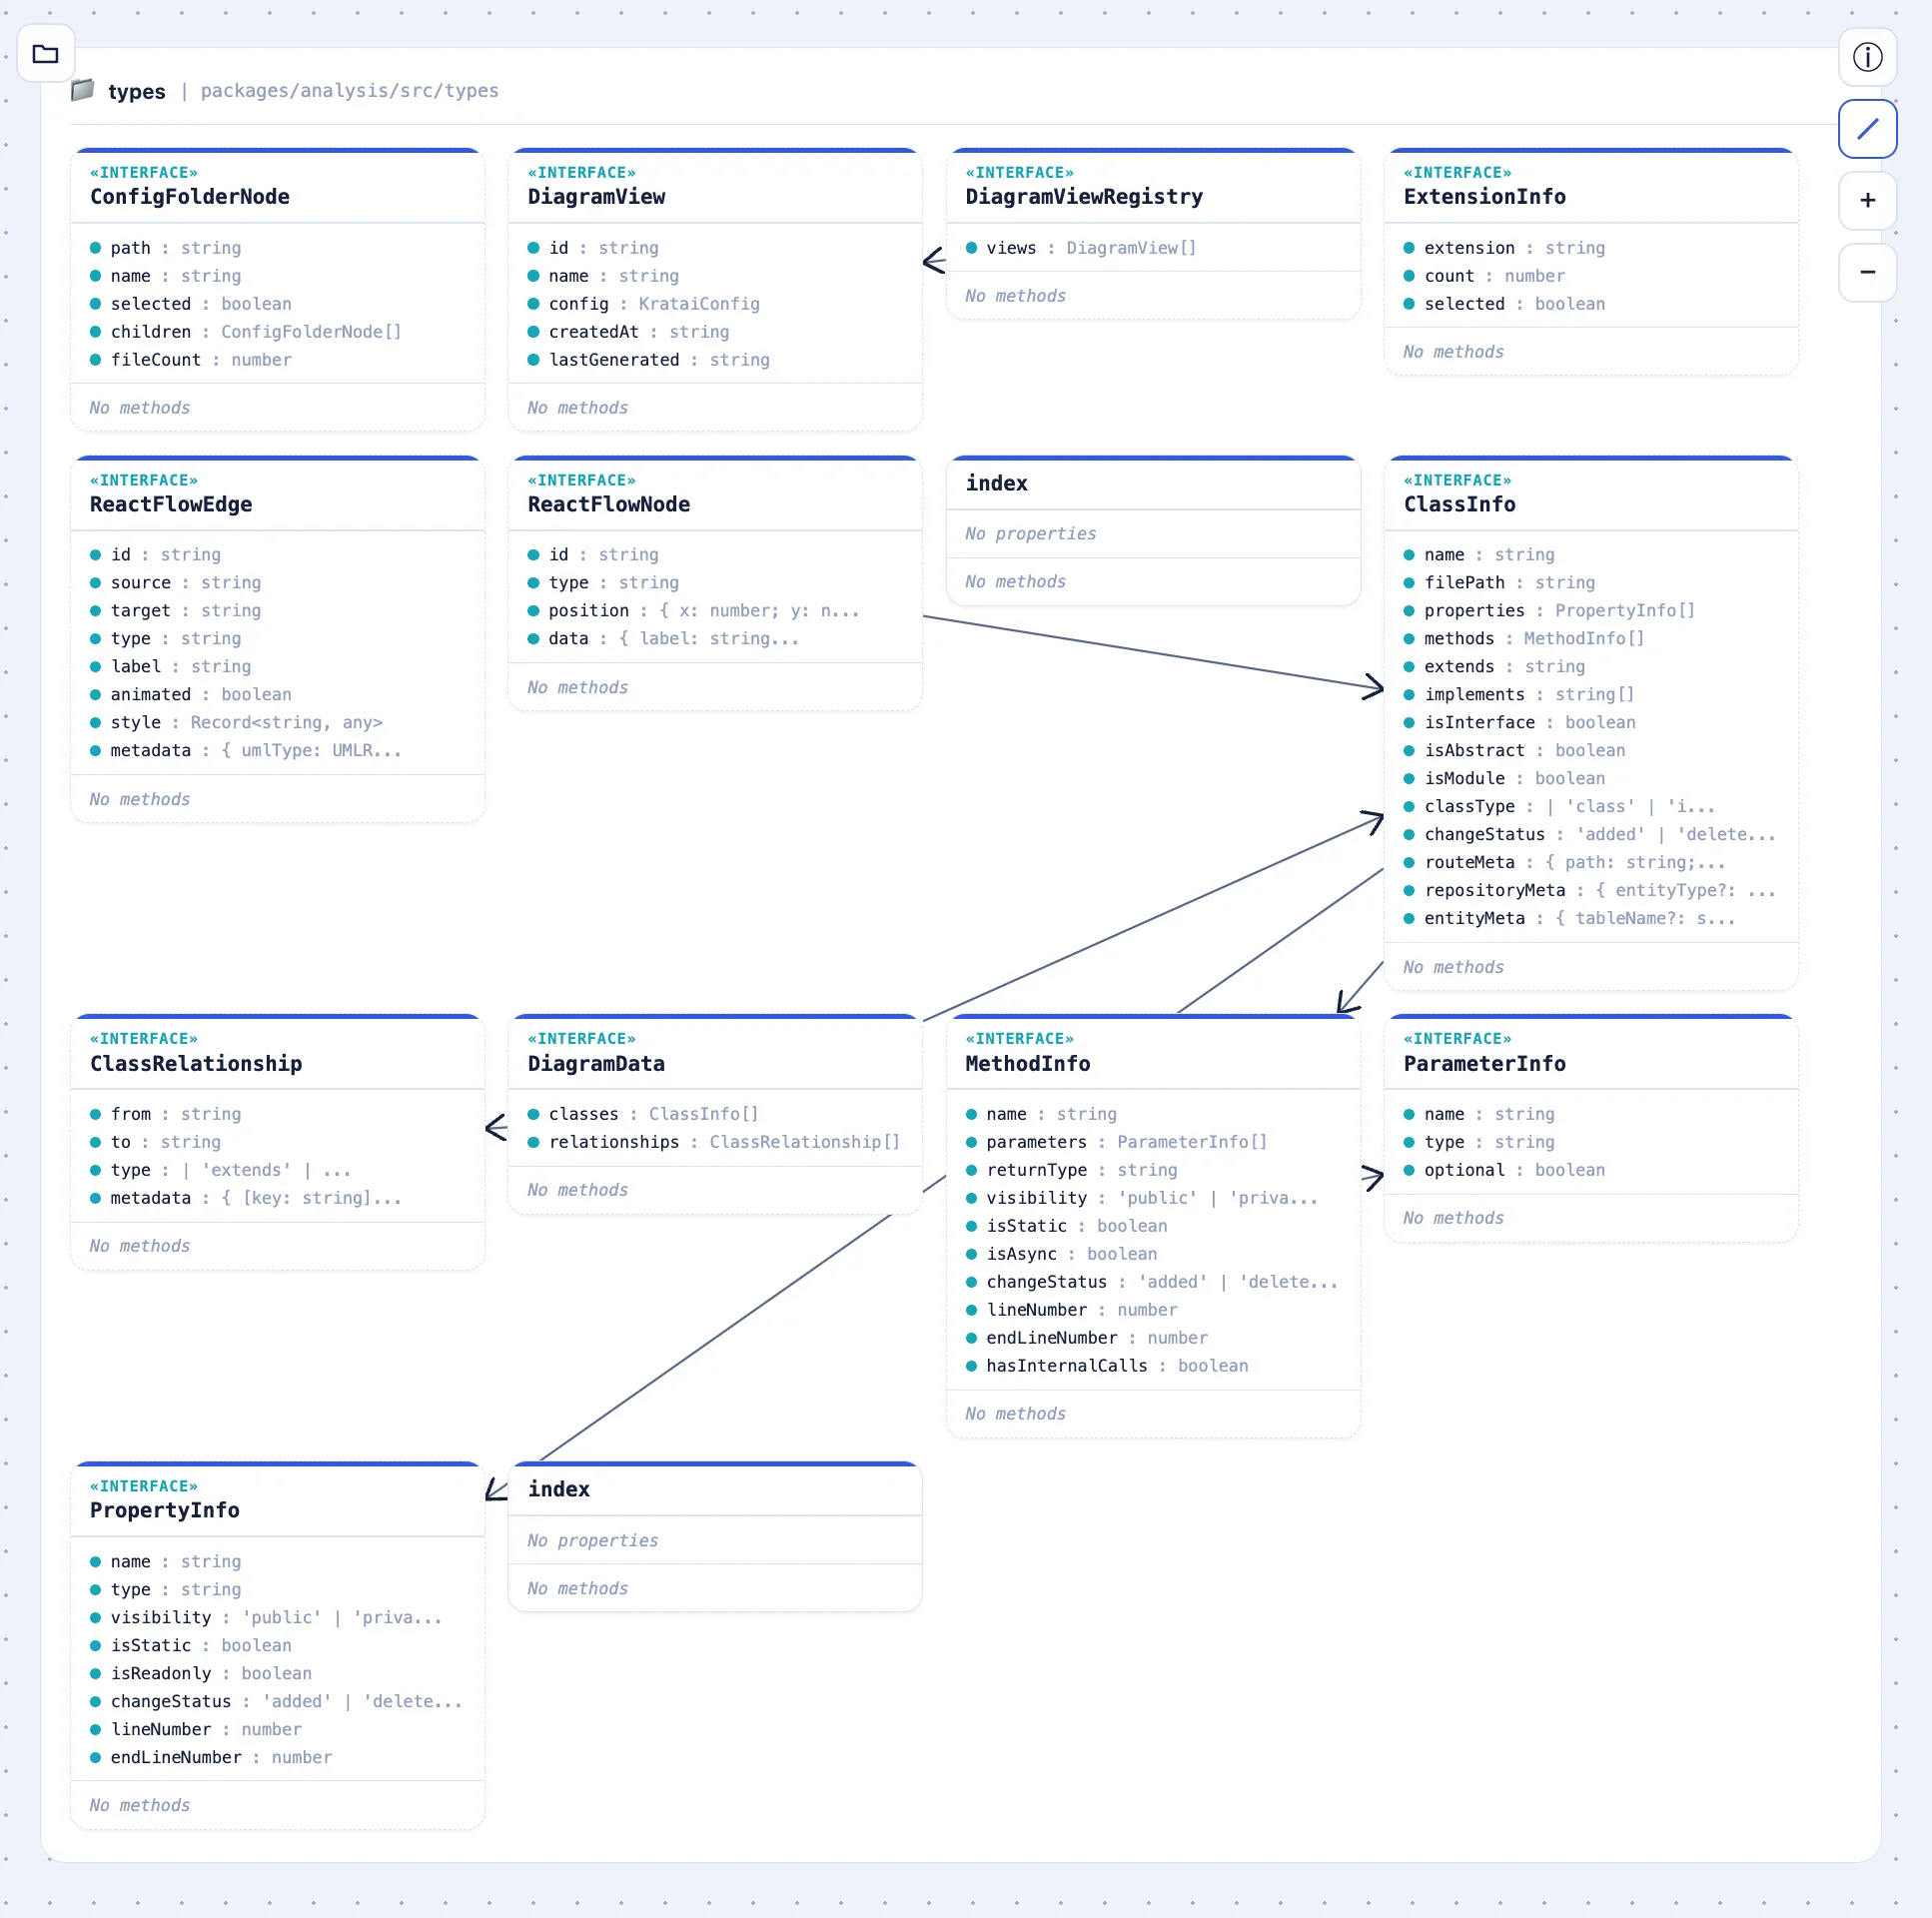
A Class Diagram shows the static structure of a project — not what it does (that's the Use Case Model) or what data it stores (that's the Data Model), but the classes and interfaces themselves, their properties and methods, and how they relate to each other. Classes are rendered as UML-style boxes grouped by folder, with typed relationship lines between them:
- extends — inheritance: this class or interface extends another.
- implements — this class implements an interface.
- uses — a dependency: one class references another without owning it.
- has — composition: one class holds a property typed as another.
kratai generates it, always up to date
The Class Diagram is part of kratai's deterministic half — generated entirely by static analysis, with zero LLM calls, so opening it never spends AI credit no matter how often you refresh it. Because it's a static parse of the real code rather than an AI summary, it reflects exactly what's there, including things an AI-generated summary would be tempted to simplify away. Open the Class Diagram view from inside the desktop app.
kratai supports TypeScript, JavaScript, Python, Java, and PHP, including common frameworks like React, Next.js, NestJS, Django, Spring Boot, and Laravel — more languages are on the way.
Uncommitted changes are marked directly on the diagram, so you see the structural impact of a change — which classes and relationships it touched — rather than just a flat list of changed lines. Useful on its own, and especially useful for reviewing changes an AI coding agent just made to your codebase — see How kratai Works for asking it to check the diagram before it touches existing architecture.
Create custom view
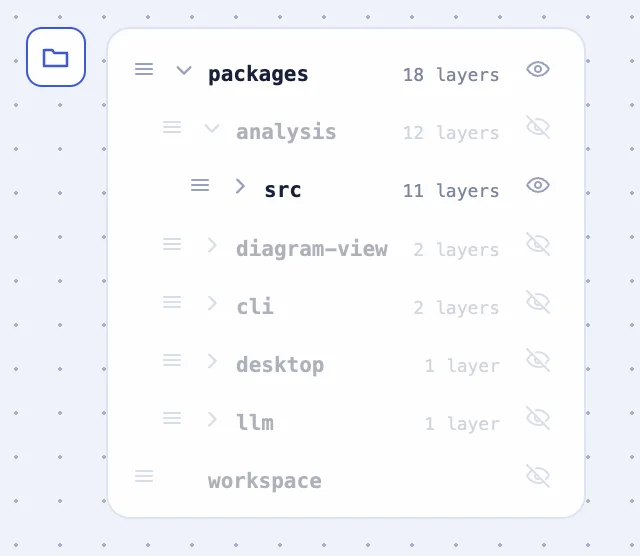
A real codebase has more classes than usefully fit on one screen at once. Each folder in the sidebar can be expanded or collapsed, and shown or hidden independently, so you can fold away the parts of the codebase that aren't relevant right now and keep the diagram focused on what you're actually working on.
Trace relationships
Click a class to highlight it and trace its direct relationships, instead of following thin lines across a dense diagram by eye.